

📄 What is the Ticker Page?
The Ticker Page is your complete stock analysis dashboard for any ticker. Think of it as:- Stock research HQ
- All data in one place
- AI-powered insights
- Decision-making tool
🔍 How to Open a Ticker Page
Method 1: Search
📱 iOS:- Tap Search icon (top of any screen)
- Type ticker or company name
- Tap result
- Press / (forward slash) keyboard shortcut
- Or click search bar
- Type ticker
- Click result
Method 2: From Feed/News
Tap/click any ticker mentioned in:- News articles
- Daily Summary
- Banana Bites
- Trending stocks
Method 3: From Portfolio
If you own the stock:- Portfolio tab → Tap your position
- Opens ticker page
Method 4: From Chat
AI mentions a stock:- Ticker appears as clickable link
- Tap/click to view full page
🎨 Ticker Page Layout
Top Section: Header
Shows at a glance:- Company name & ticker symbol
- Current price (real-time)
- Today’s change ($ and %)
- Chart preview (line chart)
Tesla, Inc. (TSLA) 15.20 (+3.38%) [Small line chart showing today’s movement]
Main Section: Tabs/Sections
📱 iOS: Swipe left/right through sections 🌐 Web: Click tabs at top Available sections:- Overview - Summary & grades
- Analysis - AI insights
- Company - Business info
- Performance - Charts & returns
- News - Latest headlines
- Financials - Earnings, revenue, metrics
- Bulls vs Bears - Sentiment analysis
- Options - Options data (if applicable)
📊 Overview Section
The main summary page.AI Snapshot Grades (⭐ Most Important)
Four letter grades A-F:- 📈 Fundamental: Company financials (A = strong)
- 📊 Technical: Chart setup (A = bullish)
- 💬 Sentiment: Market buzz (A = positive)
- 🛡️ Risk: Downside risk (A = low risk)
Quick Stats
Key metrics at a glance:- Market Cap
- P/E Ratio
- 52-Week Range
- Volume
- Average Volume
- Beta
- Dividend Yield (if applicable)
AI Summary (1-2 Sentences)
What’s happening right now: Example:“TSLA is breaking out above $465 resistance with strong volume. Momentum is bullish short-term, but valuation remains stretched. Good for swing trades, risky for long-term at current levels.”Quick answer to: “Should I buy this stock?”
Action Buttons
Quick actions:- 💬 Ask AI - Open chat about this stock
- 📊 Add to Theme - Save to a theme
- 🔔 Set Alert - Price alert
- 📈 Trade - Execute trade (if connected)
🤖 Analysis Section
”How It Makes Money”
Plain English explanation:- What does the company do?
- How do they make revenue?
- Business model explained simply
“Tesla makes money by selling electric vehicles (Model 3, Y, S, X), energy storage systems (Powerwall, Megapack), and solar products. 80% of revenue comes from vehicle sales. Also earns from software subscriptions (FSD), charging network, and regulatory credits.”
AI Deep Dive
Detailed AI analysis:- Current setup (bullish/bearish/neutral)
- Key support & resistance levels
- Catalysts (upcoming events)
- Risks to watch
- Time horizon recommendation
“Pricey or Cheap?” Card
One of the Quick Prompts - used in User’s Example Workflow #1! Shows:- Valuation analysis
- vs. industry average
- vs. historical valuation
- AI verdict: Overvalued, Fair, Undervalued
TSLA Valuation: EXPENSIVE 🔴
- P/E: 75 (Industry avg: 15)
- P/S: 8.5 (Industry avg: 2.0)
- Historical avg P/E: 45
- Verdict: Trading 67% above fair value. Wait for pullback.
🏢 Company Section
Company Story
The narrative:- Founded when?
- By whom?
- Company journey
- Major milestones
- Current stage
Key People
Leadership:- CEO
- CFO
- Key executives
- Board members
Competitive Landscape
Who are the competitors?- Direct competitors
- Market share comparison
- Competitive advantages
- Moats
📈 Performance Section
Price Charts
Interactive charts:- 1D, 5D, 1M, 3M, YTD, 1Y, 5Y, MAX
- Technical indicators (MA, RSI, MACD)
- Volume overlay
- Drawing tools
Returns Comparison
How it’s performed vs benchmarks:- vs S&P 500
- vs Nasdaq
- vs sector ETF
- vs competitors
TSLA Performance (YTD)Learn more →TSLA is outperforming all benchmarks. 🚀
- TSLA: +42.5%
- S&P 500: +18.2%
- Nasdaq: +28.5%
- Auto Sector: +12.0%
📰 News Section
Latest headlines for this stock:- Earnings announcements
- Analyst ratings
- Company news
- Sector news affecting stock
💰 Financials Section
Earnings Data
Latest quarterly & annual:- Revenue
- EPS
- Beat or miss vs estimates
- Guidance
- Key highlights
Key Metrics
Fundamental data:- P/E Ratio
- PEG Ratio
- Price/Sales
- Price/Book
- Debt/Equity
- ROE, ROA
- Profit Margin
- Revenue Growth
Financial Statements
View full statements:- Income Statement
- Balance Sheet
- Cash Flow Statement
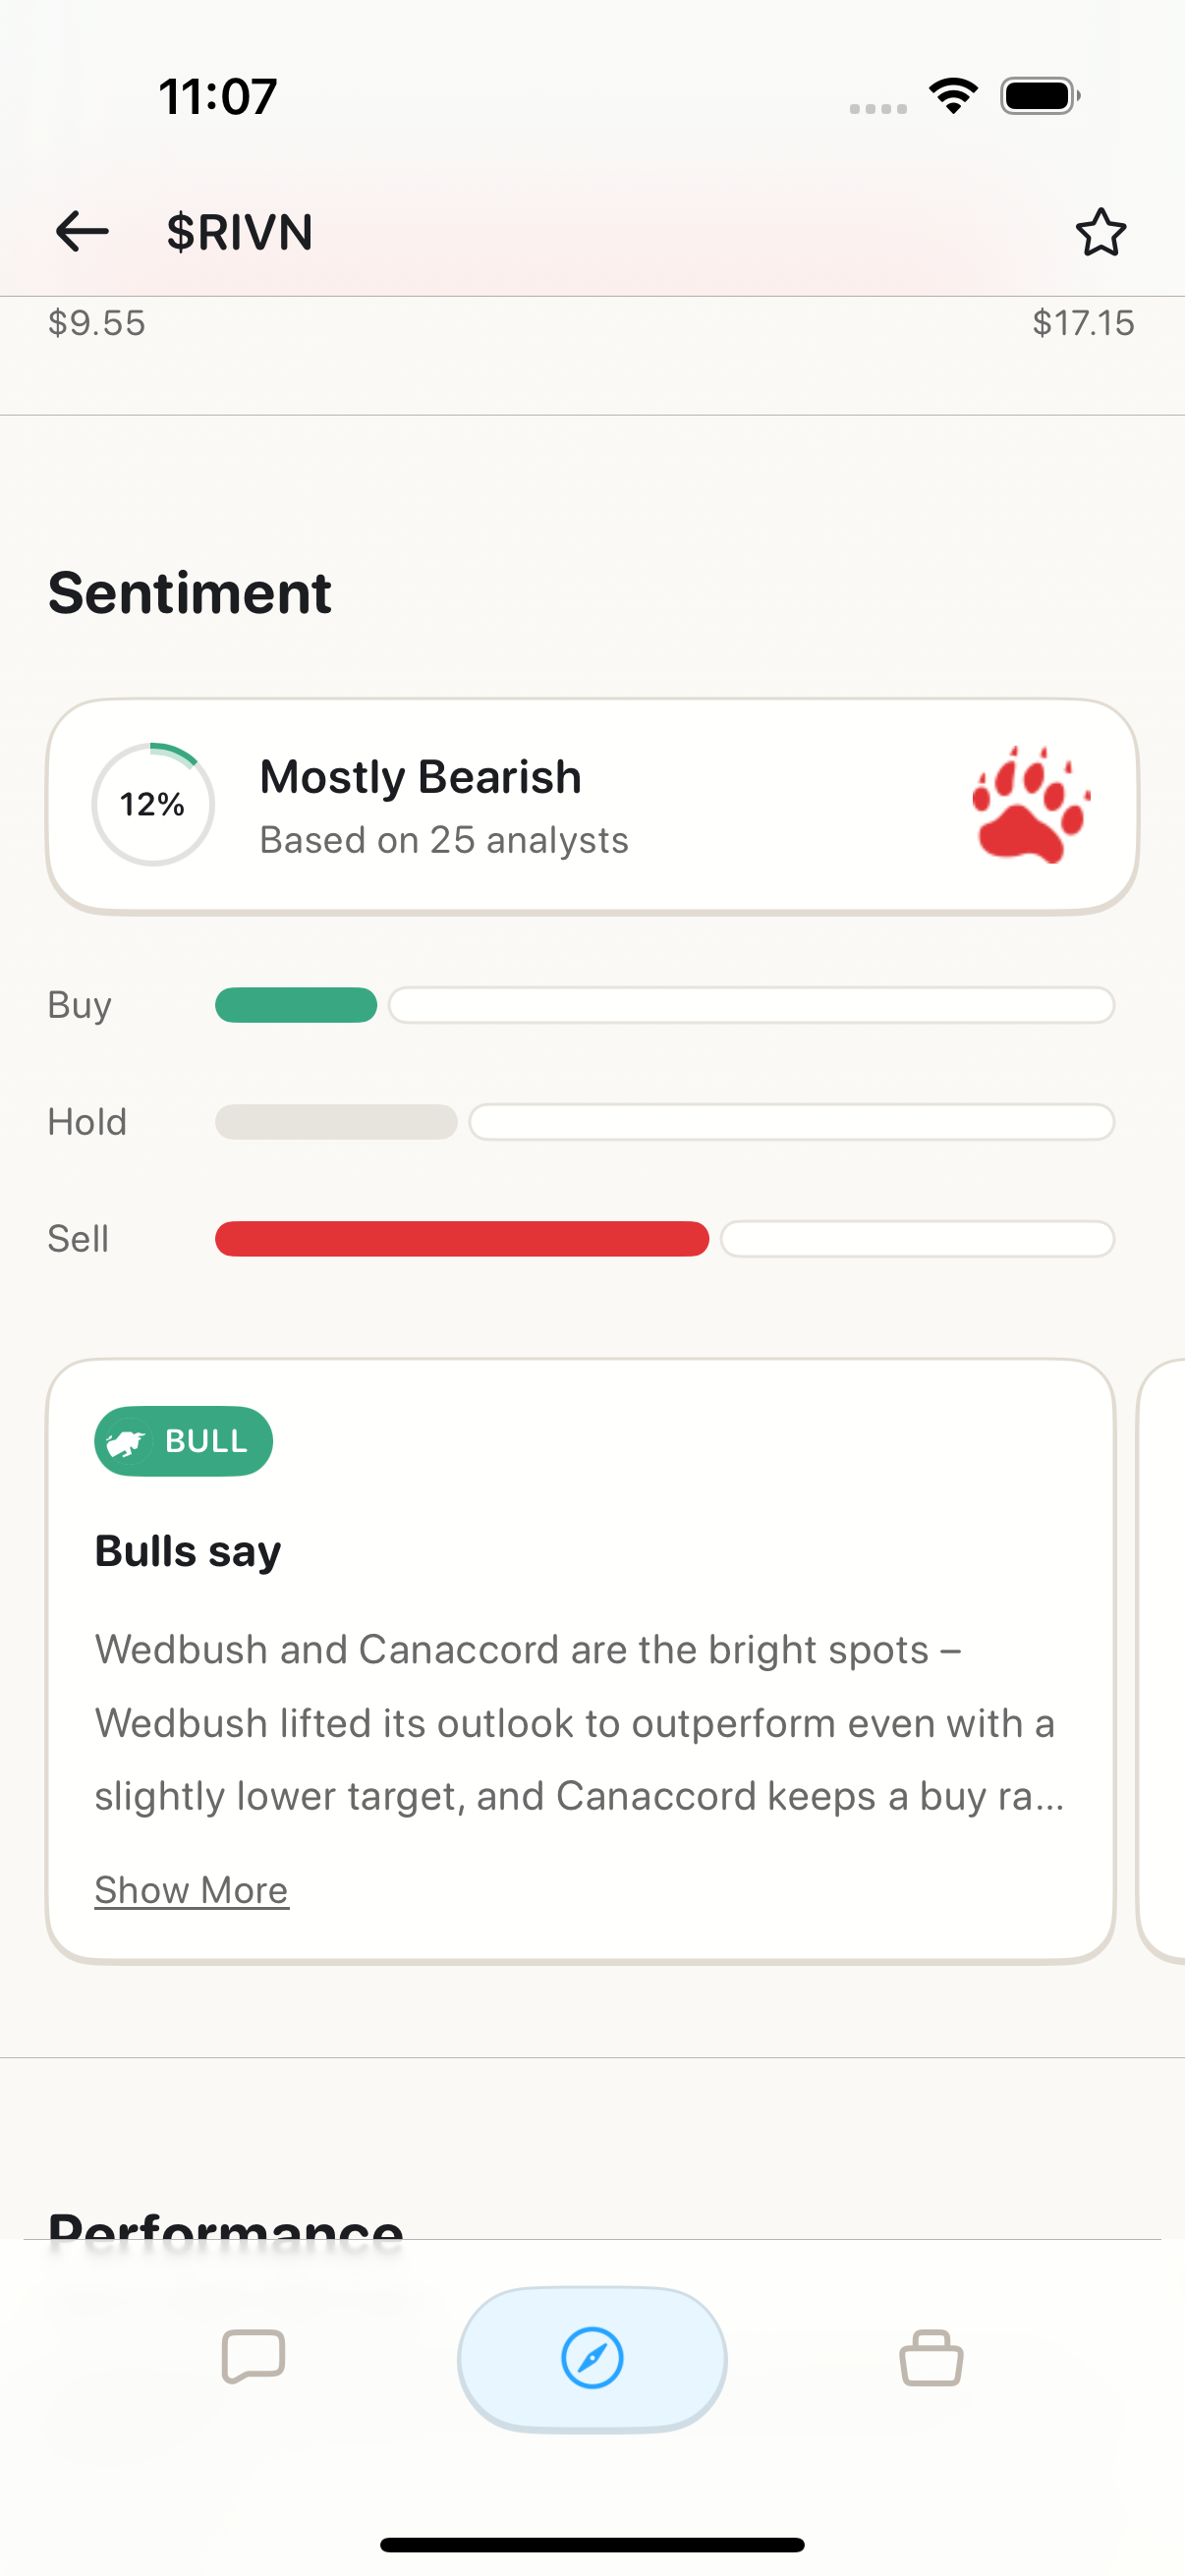
🎯 Bulls vs Bears Section
Sentiment analysis - what people think Shows:- Bullish % vs Bearish %
- Social media sentiment
- Analyst ratings breakdown
- Reddit/WSB mentions
- Twitter buzz
📈 Options Section (If Applicable)
Options data:- Implied Volatility (IV)
- Options volume
- Put/Call ratio
- Most active strikes
- Upcoming expirations
💡 Using the Ticker Page Effectively
Research Workflow
When researching a new stock: 1. Start with Overview- Check Snapshot Grades
- Read AI summary
- Quick stats
- Understand the business
- Is valuation reasonable?
- How’s it been doing?
- What’s the sentiment?
- Any catalysts?
- Tap “Ask AI” button
- Get clarification on anything
Quick Decision Framework
After viewing ticker page, ask yourself: ✅ Snapshot Grade: Mostly A’s and B’s? ✅ Valuation: Fair or undervalued? ✅ Technical: Bullish setup? ✅ Sentiment: Positive? ✅ News: Good catalysts? If 4+ are yes → Consider buying If 3 or fewer → Pass or wait🎭 Ticker Page by Companion
Blitz (Day Trader) 🚀
Emphasizes:- Technical grade
- Intraday chart
- Volume analysis
- Support/resistance
- Day trade setups
Maverick (Momentum Trader) 📈
Emphasizes:- Technical + Sentiment grades
- Multi-day charts
- Catalysts coming up
- Swing entry/exit points
Sage (Long-Term) 🏦
Emphasizes:- Fundamental grade
- Valuation metrics
- Company story
- Long-term growth potential
- Dividend info
📱 vs 🌐 Platform Differences
iOS
- ✅ Swipe through sections
- ✅ Optimized for mobile
- ✅ Quick action buttons prominent
- ✅ Share to social apps
Web
- ✅ Tabs across top
- ✅ More data visible at once
- ✅ Larger charts
- ✅ Multi-panel view
❓ FAQ
Q: Is ticker page data real-time? A: Yes! Price updates every few seconds during market hours. Q: Can I compare multiple tickers? A: Not side-by-side yet (coming soon). Open multiple tabs on web. Q: Does every stock have all sections? A: Most do. Some small caps may have limited data. Q: Can I customize what I see? A: Not yet. Default view optimized for most users. Q: Is ticker page available for crypto? A: Only crypto stocks (COIN, MARA, etc). Not BTC/ETH directly yet. Q: Can I see pre-market/after-hours data? A: Yes! Shows extended hours data when applicable.What’s Next?
Deep Dive on Ticker Features:- AI Snapshot Grades → - How stocks are graded
- Bulls vs Bears → - Sentiment analysis
- Company Story → - Business deep dive
- Performance Analysis → - Charts & comparisons
- My First Stock Research → - Uses ticker page
- Following WSB Trends → - Research trending tickers
Ticker Page = Your Stock Research Command Center. One page, all the answers! 📊🚀