> ## Documentation Index
> Fetch the complete documentation index at: https://guide.askape.com/llms.txt
> Use this file to discover all available pages before exploring further.
# Portfolio Overview
Track all your investments in one place. See what's working, what's not.
**⏱️ Time to read:** 4 minutes **📱🌐 Platform:** Both iOS & Web **👤 Best for:** Everyone with connected brokerage
***
## 📊 What is the Portfolio?
The **Portfolio** is your command center for tracking investments.
**Think of it as:**
* Your trading dashboard
* Net worth tracker
* Performance monitor
* Position manager
**Shows:**
* All your holdings (stocks, options, cash)
* Current values
* Profit/Loss
* Today's performance
* Historical returns
**Updates in real-time during market hours.**
***
## 📱 Where to Find Portfolio
### iOS
1. Open Ape AI
2. Tap **Portfolio tab** (bottom right, wallet icon)
3. See your full portfolio view
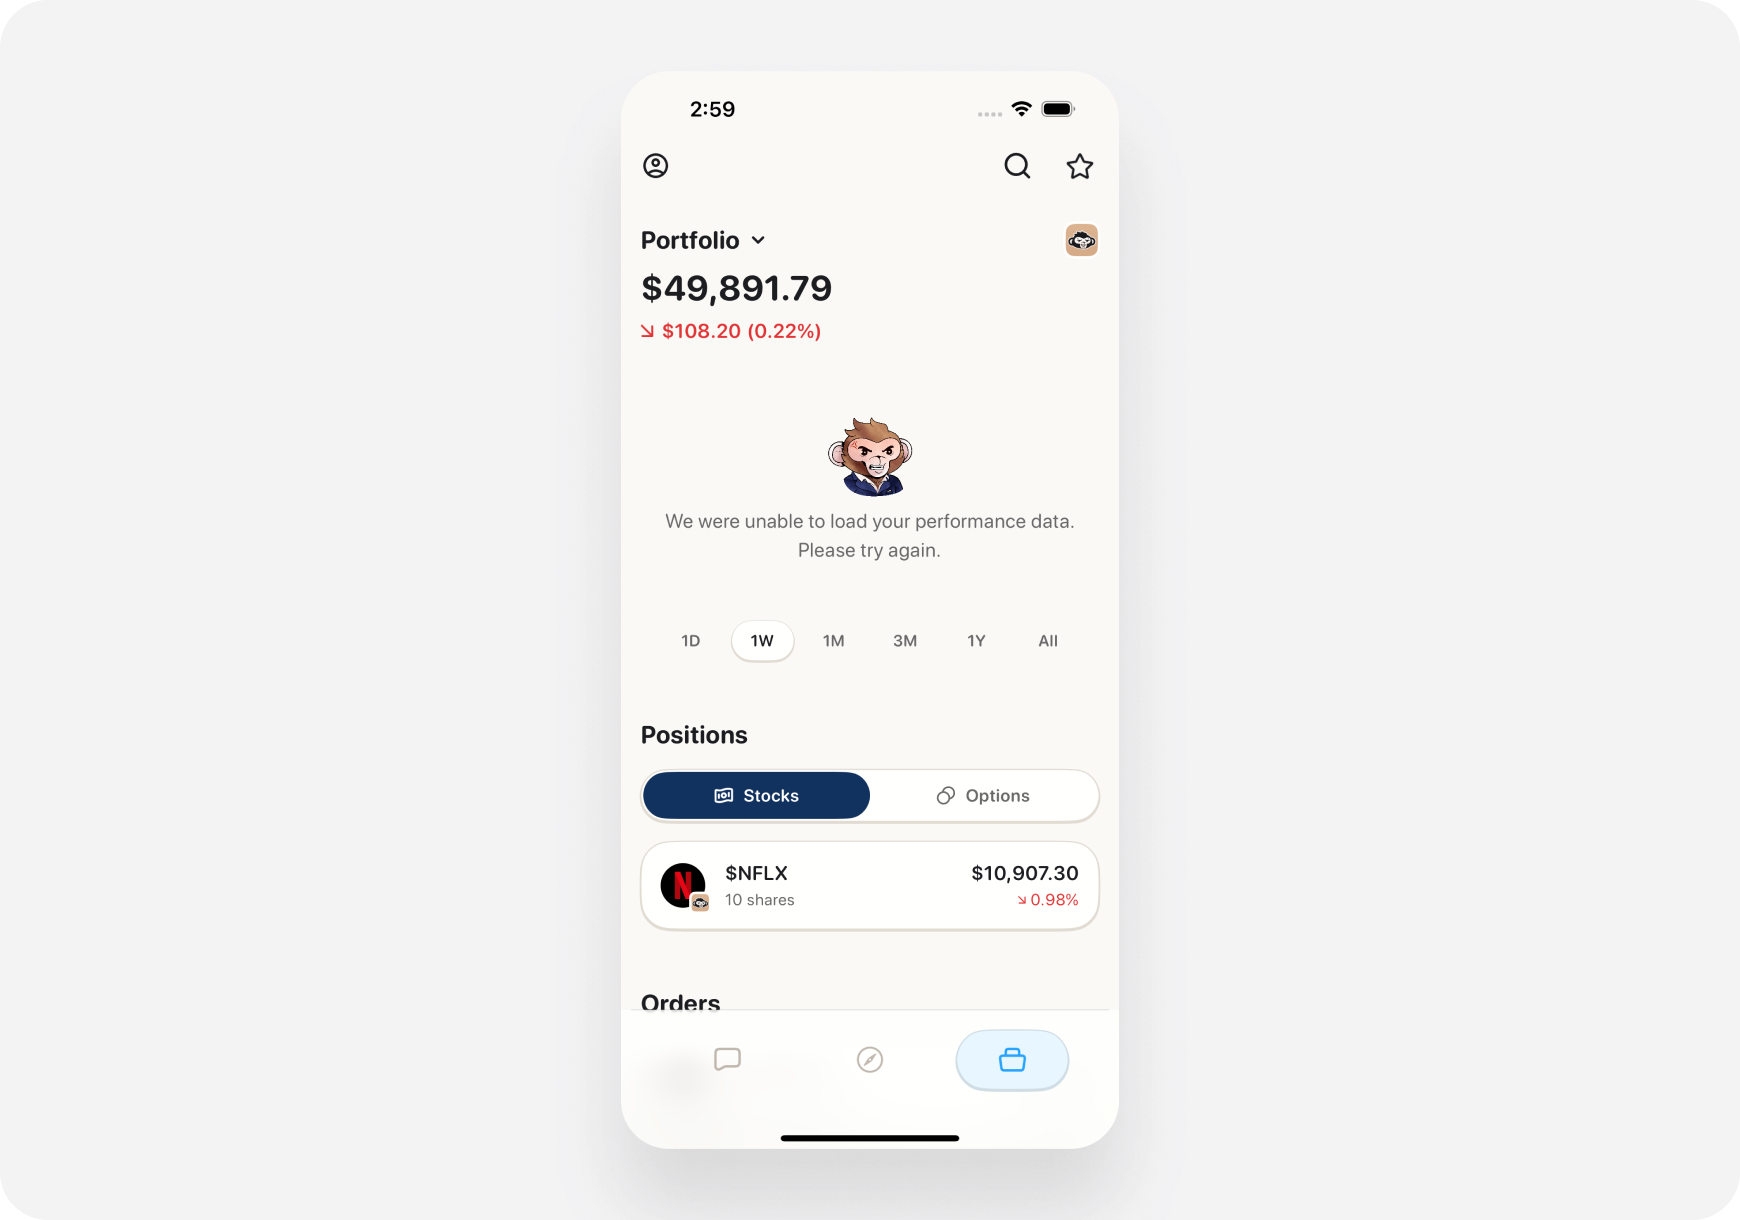 **Bottom Navigation:**
* 💬 Chat
* 🧭 Discover
* **📊 Portfolio** ← You are here
***
### Web
1. Go to app.Ape AI.com
2. Click **Portfolio** (left sidebar)
3. Full portfolio page opens
**Bottom Navigation:**
* 💬 Chat
* 🧭 Discover
* **📊 Portfolio** ← You are here
***
### Web
1. Go to app.Ape AI.com
2. Click **Portfolio** (left sidebar)
3. Full portfolio page opens
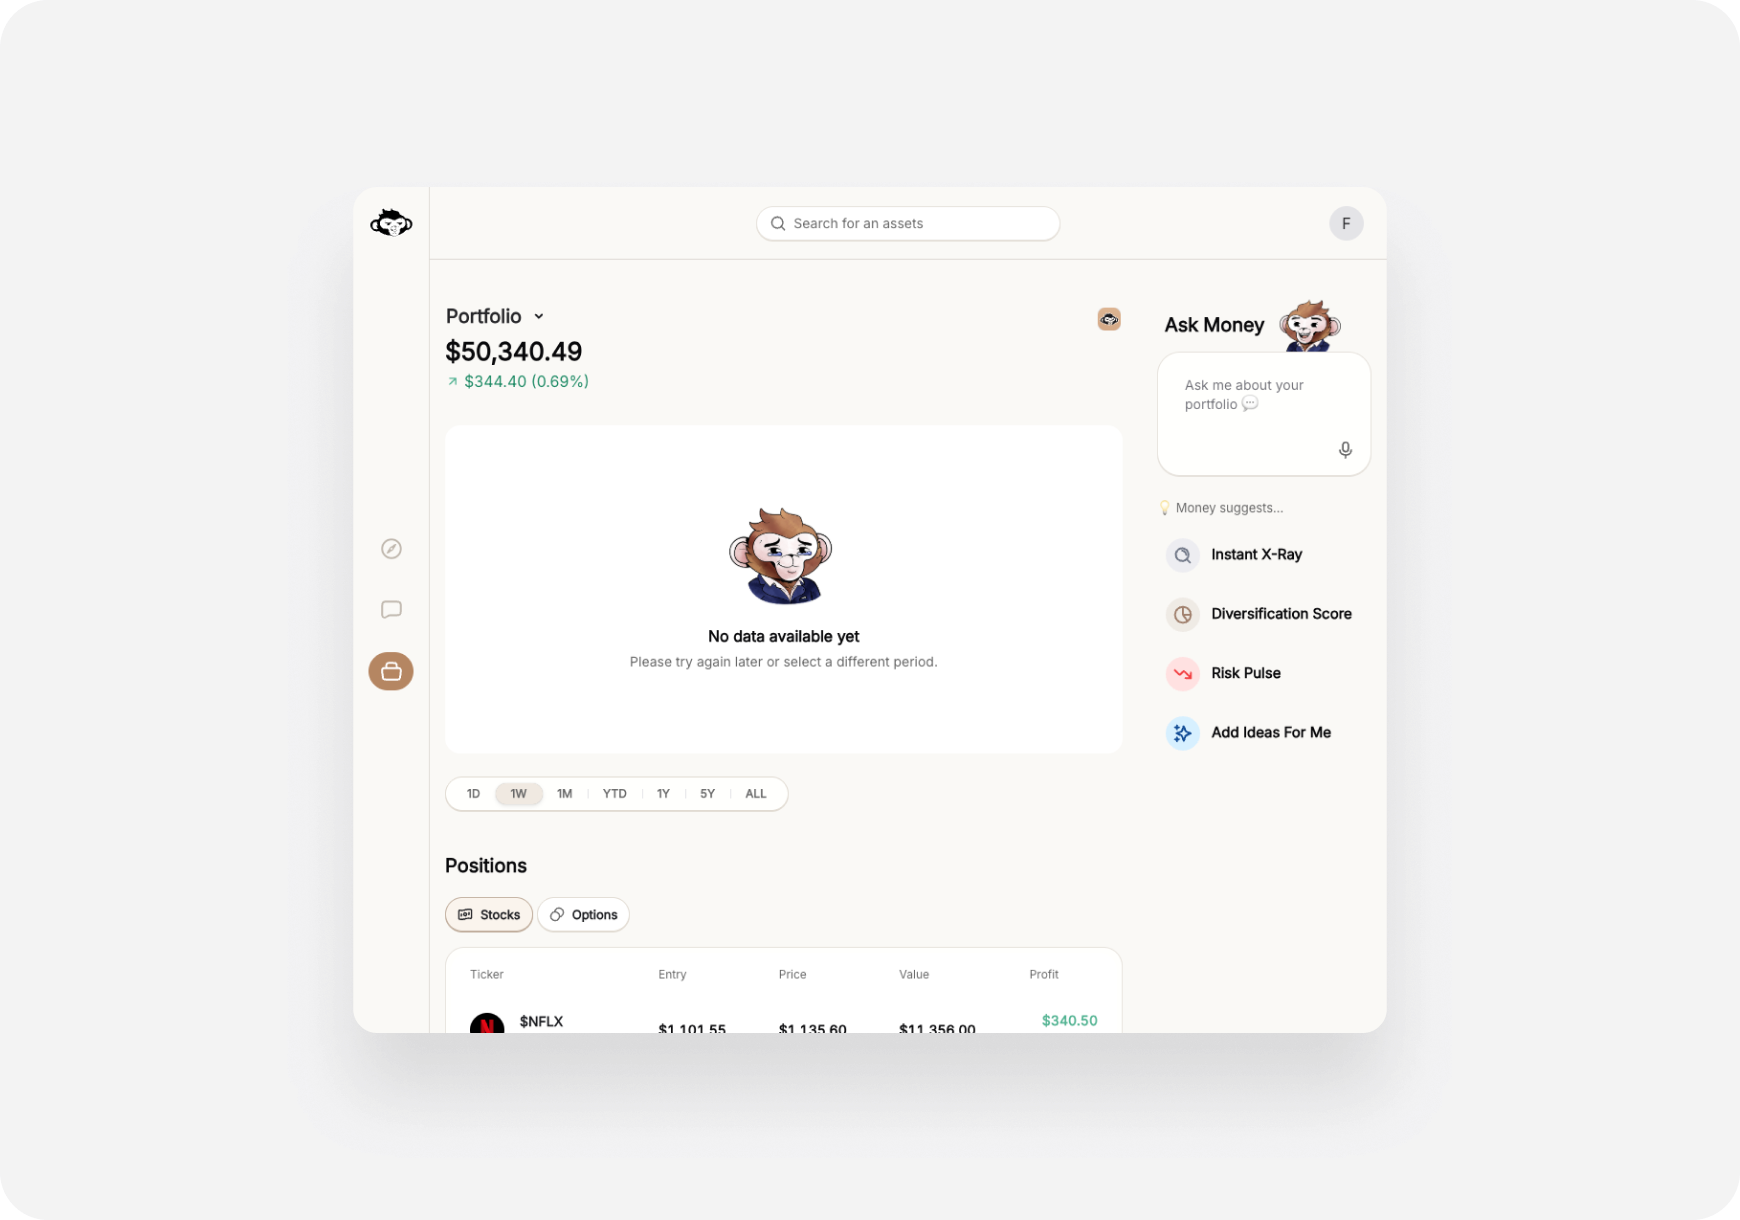 **Left Sidebar:**
* 🏠 Home
* 💬 Chat
* 🎯 Themes
* **📊 Portfolio** ← You are here
* ⚙️ Settings
***
## 🎨 Portfolio Layout
### Top Section: Summary Cards
**Total Portfolio Value 💰**
> \*\*$45,250.00** +$2,105 (+4.88%) Today +\$8,250 (+22.3%) All Time
**Shows:**
* Current total value
* Today's change (\$ and %)
* All-time P\&L (\$ and %)
***
**Cash Available 💵**
> **\$5,000.00** Available to trade
**Shows:**
* Buying power
* Settled cash
* Unsettled funds (if any)
***
**Day's Performance 📈**
> **+\$2,105 (+4.88%)** 8 positions up 🟢 | 2 down 🔴
**Shows:**
* Intraday profit/loss
* Number of winners vs losers
* Visual breakdown
***
### Middle Section: Your Positions
**List of all holdings:**
**Example Position Card:**
> **TSLA** - Tesla Inc. 10 shares
>
> **Current:** $465.20 (+$15.20, +3.38% today) **Avg Cost:** $450.00 **Total Value:** $4,652.00 **Profit:** +\$152.00 (+3.38%)
>
> Snapshot Grade: **A-** 🟢
**Tap/click to view full ticker page**
***
**Color Coding:**
* 🟢 Green = Profitable position
* 🔴 Red = Losing position
* ⚪ White/Gray = Break-even
***
**Sort Options:**
* By % Gain (biggest winners first)
* By % Loss (biggest losers first)
* By Value (largest positions first)
* By Today's Change
* Alphabetical
***
### Bottom Section: Performance Charts
**1. Portfolio Value Over Time**
* Line chart showing growth
* Toggle timeframes: 1D | 1W | 1M | 3M | 1Y | ALL
**2. Asset Allocation**
* Pie chart of your holdings
* By stock (what % is TSLA, AAPL, etc.)
* By sector (Tech 40%, Healthcare 20%, etc.)
**3. Winners vs Losers**
* Bar chart
* Green bars = Profitable positions
* Red bars = Losing positions
***
## 🎯 Key Metrics Explained
### Total Portfolio Value
**What it is:** Current market value of all your holdings + cash
**Formula:**
```
(Shares × Current Price) for each stock + Cash Balance
```
**Example:**
* 10 TSLA @ $465 = $4,650
* 50 AAPL @ $180 = $9,000
* Cash = \$5,000
* **Total = \$18,650**
***
### Cost Basis
**What it is:** How much you paid for each stock (avg if multiple buys)
**Why it matters:** Determines your profit/loss and tax liability
**Example:**
* Bought 5 TSLA @ $440 = $2,200
* Bought 5 more @ $460 = $2,300
* Cost Basis = $4,500 / 10 shares = **$450/share\*\*
***
### Unrealized P\&L
**What it is:** Paper gains/losses on open positions
**Formula:**
```
(Current Price - Cost Basis) × Shares
```
**Example:**
* 10 TSLA @ \$465 current
* Cost basis \$450
* Unrealized P\&L = ($465 - $450) × 10 = **+\$150**
**Not real money until you sell!**
***
### Realized P\&L
**What it is:** Actual profits/losses from closed trades
**Shows in:** Order history, tax reports
**Example:**
* Bought 10 AAPL @ $170 = $1,700
* Sold 10 AAPL @ $180 = $1,800
* Realized P\&L = **+\$100**
**This IS real money (and taxable).**
***
### Day Change
**What it is:** How much your portfolio moved today
**Resets daily at 4:00 PM ET close**
**Example:**
* Yesterday close: \$45,000
* Today now: \$47,105
* Day Change: **+\$2,105 (+4.68%)**
***
### Return %
**What it is:** Total return since you started
**Formula:**
```
(Current Value - Total Invested) / Total Invested × 100
```
**Example:**
* Invested \$37,000 total
* Current value \$45,250
* Return = ($45,250 - $37,000) / \$37,000 = **+22.3%**
***
## 💼 Multiple Accounts View
**Connected multiple brokerages?**
**Portfolio shows:**
1. **Combined total** at top
2. **Breakdown by account**
3. **Switch between accounts** with dropdown
**Example View:**
> **All Accounts: \$65,250**
>
> **Robinhood:** \$35,000 (12 positions)
>
> * TSLA, AAPL, NVDA, AMD, etc.
>
> **Webull:** \$25,000 (8 positions)
>
> * Day trading positions
>
> **Ape Paper:** \$5,250 (3 positions)
>
> * Testing strategies
**Filter:**
* View all accounts together
* Or select one account to view
***
## 🎭 Portfolio by Companion
### Blitz (Day Trader) View 🚀
**Focus:**
* Intraday P\&L (today's \$ change)
* Open positions (what's active NOW)
* Realized P\&L today (closed trades)
* Quick access to close positions
**Layout:** Compact, real-time focused
***
### Maverick (Momentum Trader) View 📈
**Focus:**
* Weekly/monthly performance
* Swing positions (multi-day holds)
* Upcoming exit targets
* Risk/reward per position
**Layout:** Balanced, trend-focused
***
### Sage (Long-Term) View 🏦
**Focus:**
* Total return (all-time)
* Dividend income
* Asset allocation
* Quality scores for holdings
* Long-term growth chart
**Layout:** Big-picture, fundamental metrics
***
## 🤖 AI-Powered Features
### Portfolio AI
**Your personal portfolio AI assistant.**
**Tap "Portfolio AI" button to:**
* Get portfolio analysis
* Ask questions about holdings
* Rebalancing suggestions
* Risk assessment
**Example questions:**
* "How's my portfolio doing?"
* "What should I sell?"
* "Am I too concentrated?"
* "Which holding is riskiest?"
[Learn more about Ask Maverick →](ask-maverick/)
***
### Snapshot Grades for Each Holding
**Every stock in your portfolio gets graded A-F:**
* Fundamental Grade
* Technical Grade
* Sentiment Grade
* Risk Grade
**Quickly see:** Which holdings are strong, which are weak
***
### Smart Alerts
**AI watches your portfolio and alerts you:**
* 🚨 "TSLA dropped 5% today. Time to review?"
* 💰 "AAPL up 15% since purchase. Consider taking profits?"
* ⚠️ "AMD earnings tomorrow. High risk event."
* 📊 "Your tech exposure is now 60%. Consider rebalancing."
***
## ⚙️ Portfolio Settings
### Customize Your View
**📱 iOS: Portfolio → ⚙️ (top right)** **🌐 Web: Portfolio → Settings icon**
**Options:**
* **Display:** Show/hide certain metrics
* **Sorting:** Default sort order
* **Notifications:** Portfolio alerts
* **Privacy:** Hide \$ amounts (show % only)
* **Tax Lots:** FIFO vs LIFO for cost basis
***
### Privacy Mode
**Don't want people seeing your screen?**
**Enable Privacy Mode:**
* Hides dollar amounts
* Shows only percentages
* Masks position sizes
**Great for:** Screenshots, showing friends, public settings
***
## 📊 Performance Tracking
### Time Period Views
**Toggle between:**
* **1D:** Today's performance
* **1W:** This week
* **1M:** This month
* **3M:** Quarter performance
* **YTD:** Year to date
* **1Y:** Past year
* **ALL:** Since inception
**See:** How your portfolio performed in each timeframe
***
### Benchmark Comparison
**Compare your performance to:**
* S\&P 500 (SPY)
* Nasdaq (QQQ)
* Dow Jones (DIA)
* Custom benchmark
**Example:**
> **Your Portfolio:** +22.3% **S\&P 500:** +15.8% **You're beating the market by +6.5%!** 🎉
**Or:**
> **Your Portfolio:** +8.2% **S\&P 500:** +15.8% **You're underperforming by -7.6%** 😔
**Humbling but important to know!**
***
## 💡 Pro Tips
### 1. Check Portfolio Daily (But Don't Obsess)
**Morning routine:**
* Check overall P\&L
* See biggest movers
* Read AI alerts
* Plan day's trades
**Don't check every 5 minutes. That's stressful.**
***
### 2. Use Snapshot Grades
**Quick portfolio health check:**
* Sort by grade (worst first)
* See which holdings are struggling
* Consider trimming positions with D or F grades
* Double down on A grades
***
### 3. Monitor Allocation
**Don't be too concentrated:**
* Keep any single stock under 20% of portfolio
* Diversify across sectors
* AI will alert if you're too concentrated
***
### 4. Set Target Exits
**For each position, know:**
* Profit target (where to sell for gains)
* Stop loss (where to bail if wrong)
* Time frame (how long to hold)
**Portfolio helps you track this.**
***
### 5. Review Weekly, Not Daily
**Weekly review (Sunday evening):**
* What worked this week?
* What didn't?
* Any positions to trim?
* What to add next week?
**Deep review monthly.**
***
## ❓ FAQ
**Q: Why doesn't my portfolio match my broker exactly?** A: Small delays (1-2 seconds) during fast markets. Refresh if needed.
**Q: Can I manually add positions?** A: No, positions sync from connected brokerages. Use Ape Paper Trading to track paper positions.
**Q: Does Portfolio include options?** A: Yes! Options positions shown with expiration and strike.
**Q: What about crypto?** A: Crypto stocks (COIN, MARA) yes. Actual crypto (BTC, ETH) not yet.
**Q: Can I see historical portfolio value?** A: Yes! Use the time period charts (1M, 3M, 1Y, ALL).
**Q: Does Portfolio include dividends?** A: Yes! Dividend income shown in realized P\&L.
***
## What's Next?
**Explore Portfolio Features:**
* [Tracking Positions →](/features/portfolio/positions) - Manage your holdings
* [Portfolio AI →](/features/portfolio/ask-maverick) - Portfolio AI assistant
* [AI Analysis Tools →](/features/portfolio/ai-tools) - Advanced portfolio analysis
**Improve Your Portfolio:**
* [Portfolio Health Check →](/features/portfolio/ask-maverick) - Review your holdings
***
**Your Portfolio = Your Trading Command Center. Check it daily! 📊🚀**
**Left Sidebar:**
* 🏠 Home
* 💬 Chat
* 🎯 Themes
* **📊 Portfolio** ← You are here
* ⚙️ Settings
***
## 🎨 Portfolio Layout
### Top Section: Summary Cards
**Total Portfolio Value 💰**
> \*\*$45,250.00** +$2,105 (+4.88%) Today +\$8,250 (+22.3%) All Time
**Shows:**
* Current total value
* Today's change (\$ and %)
* All-time P\&L (\$ and %)
***
**Cash Available 💵**
> **\$5,000.00** Available to trade
**Shows:**
* Buying power
* Settled cash
* Unsettled funds (if any)
***
**Day's Performance 📈**
> **+\$2,105 (+4.88%)** 8 positions up 🟢 | 2 down 🔴
**Shows:**
* Intraday profit/loss
* Number of winners vs losers
* Visual breakdown
***
### Middle Section: Your Positions
**List of all holdings:**
**Example Position Card:**
> **TSLA** - Tesla Inc. 10 shares
>
> **Current:** $465.20 (+$15.20, +3.38% today) **Avg Cost:** $450.00 **Total Value:** $4,652.00 **Profit:** +\$152.00 (+3.38%)
>
> Snapshot Grade: **A-** 🟢
**Tap/click to view full ticker page**
***
**Color Coding:**
* 🟢 Green = Profitable position
* 🔴 Red = Losing position
* ⚪ White/Gray = Break-even
***
**Sort Options:**
* By % Gain (biggest winners first)
* By % Loss (biggest losers first)
* By Value (largest positions first)
* By Today's Change
* Alphabetical
***
### Bottom Section: Performance Charts
**1. Portfolio Value Over Time**
* Line chart showing growth
* Toggle timeframes: 1D | 1W | 1M | 3M | 1Y | ALL
**2. Asset Allocation**
* Pie chart of your holdings
* By stock (what % is TSLA, AAPL, etc.)
* By sector (Tech 40%, Healthcare 20%, etc.)
**3. Winners vs Losers**
* Bar chart
* Green bars = Profitable positions
* Red bars = Losing positions
***
## 🎯 Key Metrics Explained
### Total Portfolio Value
**What it is:** Current market value of all your holdings + cash
**Formula:**
```
(Shares × Current Price) for each stock + Cash Balance
```
**Example:**
* 10 TSLA @ $465 = $4,650
* 50 AAPL @ $180 = $9,000
* Cash = \$5,000
* **Total = \$18,650**
***
### Cost Basis
**What it is:** How much you paid for each stock (avg if multiple buys)
**Why it matters:** Determines your profit/loss and tax liability
**Example:**
* Bought 5 TSLA @ $440 = $2,200
* Bought 5 more @ $460 = $2,300
* Cost Basis = $4,500 / 10 shares = **$450/share\*\*
***
### Unrealized P\&L
**What it is:** Paper gains/losses on open positions
**Formula:**
```
(Current Price - Cost Basis) × Shares
```
**Example:**
* 10 TSLA @ \$465 current
* Cost basis \$450
* Unrealized P\&L = ($465 - $450) × 10 = **+\$150**
**Not real money until you sell!**
***
### Realized P\&L
**What it is:** Actual profits/losses from closed trades
**Shows in:** Order history, tax reports
**Example:**
* Bought 10 AAPL @ $170 = $1,700
* Sold 10 AAPL @ $180 = $1,800
* Realized P\&L = **+\$100**
**This IS real money (and taxable).**
***
### Day Change
**What it is:** How much your portfolio moved today
**Resets daily at 4:00 PM ET close**
**Example:**
* Yesterday close: \$45,000
* Today now: \$47,105
* Day Change: **+\$2,105 (+4.68%)**
***
### Return %
**What it is:** Total return since you started
**Formula:**
```
(Current Value - Total Invested) / Total Invested × 100
```
**Example:**
* Invested \$37,000 total
* Current value \$45,250
* Return = ($45,250 - $37,000) / \$37,000 = **+22.3%**
***
## 💼 Multiple Accounts View
**Connected multiple brokerages?**
**Portfolio shows:**
1. **Combined total** at top
2. **Breakdown by account**
3. **Switch between accounts** with dropdown
**Example View:**
> **All Accounts: \$65,250**
>
> **Robinhood:** \$35,000 (12 positions)
>
> * TSLA, AAPL, NVDA, AMD, etc.
>
> **Webull:** \$25,000 (8 positions)
>
> * Day trading positions
>
> **Ape Paper:** \$5,250 (3 positions)
>
> * Testing strategies
**Filter:**
* View all accounts together
* Or select one account to view
***
## 🎭 Portfolio by Companion
### Blitz (Day Trader) View 🚀
**Focus:**
* Intraday P\&L (today's \$ change)
* Open positions (what's active NOW)
* Realized P\&L today (closed trades)
* Quick access to close positions
**Layout:** Compact, real-time focused
***
### Maverick (Momentum Trader) View 📈
**Focus:**
* Weekly/monthly performance
* Swing positions (multi-day holds)
* Upcoming exit targets
* Risk/reward per position
**Layout:** Balanced, trend-focused
***
### Sage (Long-Term) View 🏦
**Focus:**
* Total return (all-time)
* Dividend income
* Asset allocation
* Quality scores for holdings
* Long-term growth chart
**Layout:** Big-picture, fundamental metrics
***
## 🤖 AI-Powered Features
### Portfolio AI
**Your personal portfolio AI assistant.**
**Tap "Portfolio AI" button to:**
* Get portfolio analysis
* Ask questions about holdings
* Rebalancing suggestions
* Risk assessment
**Example questions:**
* "How's my portfolio doing?"
* "What should I sell?"
* "Am I too concentrated?"
* "Which holding is riskiest?"
[Learn more about Ask Maverick →](ask-maverick/)
***
### Snapshot Grades for Each Holding
**Every stock in your portfolio gets graded A-F:**
* Fundamental Grade
* Technical Grade
* Sentiment Grade
* Risk Grade
**Quickly see:** Which holdings are strong, which are weak
***
### Smart Alerts
**AI watches your portfolio and alerts you:**
* 🚨 "TSLA dropped 5% today. Time to review?"
* 💰 "AAPL up 15% since purchase. Consider taking profits?"
* ⚠️ "AMD earnings tomorrow. High risk event."
* 📊 "Your tech exposure is now 60%. Consider rebalancing."
***
## ⚙️ Portfolio Settings
### Customize Your View
**📱 iOS: Portfolio → ⚙️ (top right)** **🌐 Web: Portfolio → Settings icon**
**Options:**
* **Display:** Show/hide certain metrics
* **Sorting:** Default sort order
* **Notifications:** Portfolio alerts
* **Privacy:** Hide \$ amounts (show % only)
* **Tax Lots:** FIFO vs LIFO for cost basis
***
### Privacy Mode
**Don't want people seeing your screen?**
**Enable Privacy Mode:**
* Hides dollar amounts
* Shows only percentages
* Masks position sizes
**Great for:** Screenshots, showing friends, public settings
***
## 📊 Performance Tracking
### Time Period Views
**Toggle between:**
* **1D:** Today's performance
* **1W:** This week
* **1M:** This month
* **3M:** Quarter performance
* **YTD:** Year to date
* **1Y:** Past year
* **ALL:** Since inception
**See:** How your portfolio performed in each timeframe
***
### Benchmark Comparison
**Compare your performance to:**
* S\&P 500 (SPY)
* Nasdaq (QQQ)
* Dow Jones (DIA)
* Custom benchmark
**Example:**
> **Your Portfolio:** +22.3% **S\&P 500:** +15.8% **You're beating the market by +6.5%!** 🎉
**Or:**
> **Your Portfolio:** +8.2% **S\&P 500:** +15.8% **You're underperforming by -7.6%** 😔
**Humbling but important to know!**
***
## 💡 Pro Tips
### 1. Check Portfolio Daily (But Don't Obsess)
**Morning routine:**
* Check overall P\&L
* See biggest movers
* Read AI alerts
* Plan day's trades
**Don't check every 5 minutes. That's stressful.**
***
### 2. Use Snapshot Grades
**Quick portfolio health check:**
* Sort by grade (worst first)
* See which holdings are struggling
* Consider trimming positions with D or F grades
* Double down on A grades
***
### 3. Monitor Allocation
**Don't be too concentrated:**
* Keep any single stock under 20% of portfolio
* Diversify across sectors
* AI will alert if you're too concentrated
***
### 4. Set Target Exits
**For each position, know:**
* Profit target (where to sell for gains)
* Stop loss (where to bail if wrong)
* Time frame (how long to hold)
**Portfolio helps you track this.**
***
### 5. Review Weekly, Not Daily
**Weekly review (Sunday evening):**
* What worked this week?
* What didn't?
* Any positions to trim?
* What to add next week?
**Deep review monthly.**
***
## ❓ FAQ
**Q: Why doesn't my portfolio match my broker exactly?** A: Small delays (1-2 seconds) during fast markets. Refresh if needed.
**Q: Can I manually add positions?** A: No, positions sync from connected brokerages. Use Ape Paper Trading to track paper positions.
**Q: Does Portfolio include options?** A: Yes! Options positions shown with expiration and strike.
**Q: What about crypto?** A: Crypto stocks (COIN, MARA) yes. Actual crypto (BTC, ETH) not yet.
**Q: Can I see historical portfolio value?** A: Yes! Use the time period charts (1M, 3M, 1Y, ALL).
**Q: Does Portfolio include dividends?** A: Yes! Dividend income shown in realized P\&L.
***
## What's Next?
**Explore Portfolio Features:**
* [Tracking Positions →](/features/portfolio/positions) - Manage your holdings
* [Portfolio AI →](/features/portfolio/ask-maverick) - Portfolio AI assistant
* [AI Analysis Tools →](/features/portfolio/ai-tools) - Advanced portfolio analysis
**Improve Your Portfolio:**
* [Portfolio Health Check →](/features/portfolio/ask-maverick) - Review your holdings
***
**Your Portfolio = Your Trading Command Center. Check it daily! 📊🚀**